The TPI UK Sectoral Productivity Dashboard allows users to explore the TPI UK Sectoral Scorecard data in more detail through a range interactive visualisations. It includes 3 tabs:
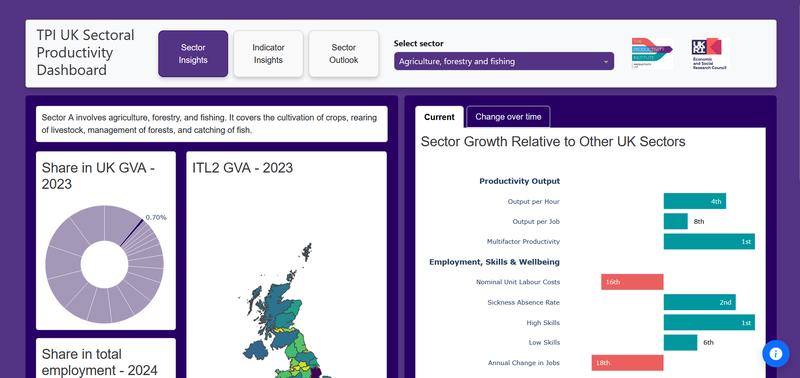
Sectoral Insights - taking inspiration from the scorecards, this tab shows how a sector is growing compared to the rest of the UK. It also gives a more detailed look at a sector's productivity, breaking it down into subsectors and ITL2 regions.
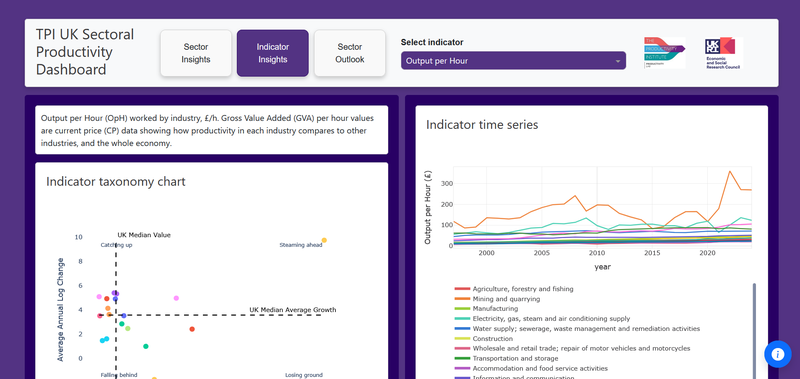
Indicator Insights - a more analytical page investigating the trends across different productivity drivers over time.
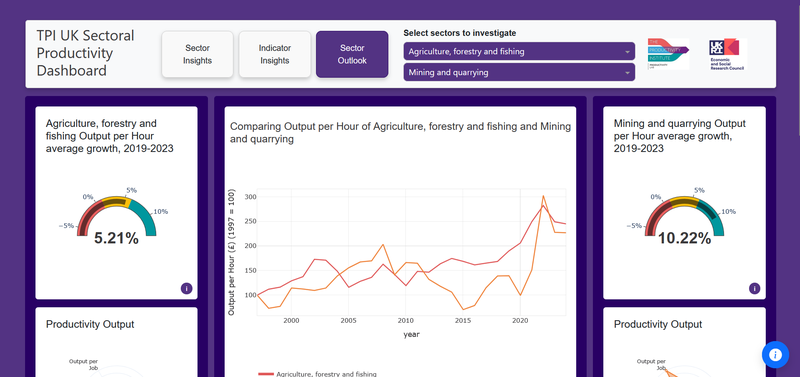
Sector Outlook - allowing the selection of 2 different sectors to discover patterns in the productivity drivers across sectors. This gives a closer look at the dataset powering the tool.