By Raquel Ortega-Argiles, William Sarsfield and Nathan McKeogh
The TPI Productivity Laboratory has produced the latest series of regional productivity scorecards for UK regions under the Mayoral Combined Authority (MCA) framework, together with its related dynamic dashboards.
The purpose of these scorecards and dashboards is to provide a detailed analysis of the productivity performance of the UK MCAs by comparing the MCAs and its areas against UK averages across multiple productivity drivers.
The 2025 MCA Productivity Scorecards and Dashboard series covers the United Kingdom as a whole and 16 MCA areas including: Greater London, West of England, Greater Manchester, York and North Yorkshire, Hull and East Yorkshire, Liverpool City Region, West Yorkshire, Lancashire, North East, West Midlands, East Midlands, Tess Valley, Devon and Torby, South Yorkshire, Greater Lincolnshire, Cambridgeshire and Peterborough.
This 2025 edition includes the latest updates and additions by the ONS regarding various geographical unit aggregations and the most recent revisions of regional productivity data.
The key metrics include a UK-based taxonomy that classifies the MCA as Losing Ground, Falling Behind, Catching Up, or Steaming Ahead based on its productivity performance over the years and relative to the UK regional average.
To illustrate this categorisation, Figure 1 provides a scatter plot comparing UK Mayoral Combined Authority (MCA) regions along two dimensions: 2023 output per hour worked (£), which represents productivity level, and the 2008-2023 average annual percentage change in productivity, which represents long-term productivity growth. These dimensions are compared to the UK regional average and to the UK MCAs regional average.
Source: TPI Productivity Lab – UK Regional Productivity Growth Data Tool
Greater London stands out as the most productive region, with productivity around £50 per hour. Still, it also has the lowest long-term growth, placing it in the Losing Ground category compared to the UK regional average. Greater Manchester, by contrast, shows the strongest growth at approximately 1.2% and a mid-range productivity of £40 per hour, making it a Catching Up region relative to the UK average and a Steaming Ahead region compared to the MCA average. Tees Valley and the North East also exhibit above-average growth (0.8–1.0%) but lower productivity levels (£35–£38 per hour), positioning them as Catching Up. Meanwhile, regions such as the West Midlands, the East Midlands, and York and North Yorkshire have modest productivity (£37–£39 per hour) and low growth (0.2–0.4%), placing them in the Falling Behind category. The West of England sits near the centre with average productivity (£42 per hour) and growth (~0.45%), classified as Losing Ground against the UK average but Steaming Ahead relative to MCA peers. Overall, most regions cluster around £38–£42 per hour with moderate growth rates of 0.4–0.6%, close to the central benchmark.
All of these differences in productivity performance may be explained by analysing the productivity of the main drivers included in our 2025 TPI MCA Productivity Scorecards.
As shown in the MCA United Kingdom Productivity Scorecards summary table, the analysis of 16 UK regions reveals significant disparities not only in GVA per hour and growth but in the productivity drivers: export intensity, business dynamism, workforce skills, and digital connectivity.
General insights from our scorecards reveal a persistent productivity gap between London and peripheral regions, suggesting a concentration of high-value sectors in the UK capital region.
While Greater London leads in most metrics, several regions lag behind national averages, indicating structural challenges that require targeted interventions. Export strength is higher in manufacturing-heavy regions like the East Midlands, while service-oriented areas underperform.
In terms of business dynamism, entrepreneurial activity clearly correlates with urban density and access to finance; this is why the top-performing regions are urban areas such as the West Midlands, Greater Manchester, the Liverpool City Region, and Greater London.
Skills gap remains a critical barrier to productivity in central and northern regions. The scorecards also illustrate important local labour market disparities, in particular, the ones reflected in the wealth and health of the working-age population significant inequality can be found in the percentage of inactive population due to illness, with regions like South Yorkshire (35.4%), Hull and East Yorkshire (34.6%) or Liverpool City Region (34.4%) presenting some high figures relative to the UK regional average.
In terms of connectivity, while the UK average is clearly above many other countries in 5G coverage and Gigabit connectivity, connectivity disparities between urban and rural areas (Devon and Torbay) risk widening the digital divide and limiting remote work opportunities.
Investment per job (GFCF, ICT, intangibles) also shows large disparities reflecting uneven capital deepening and innovation capacity across the country.
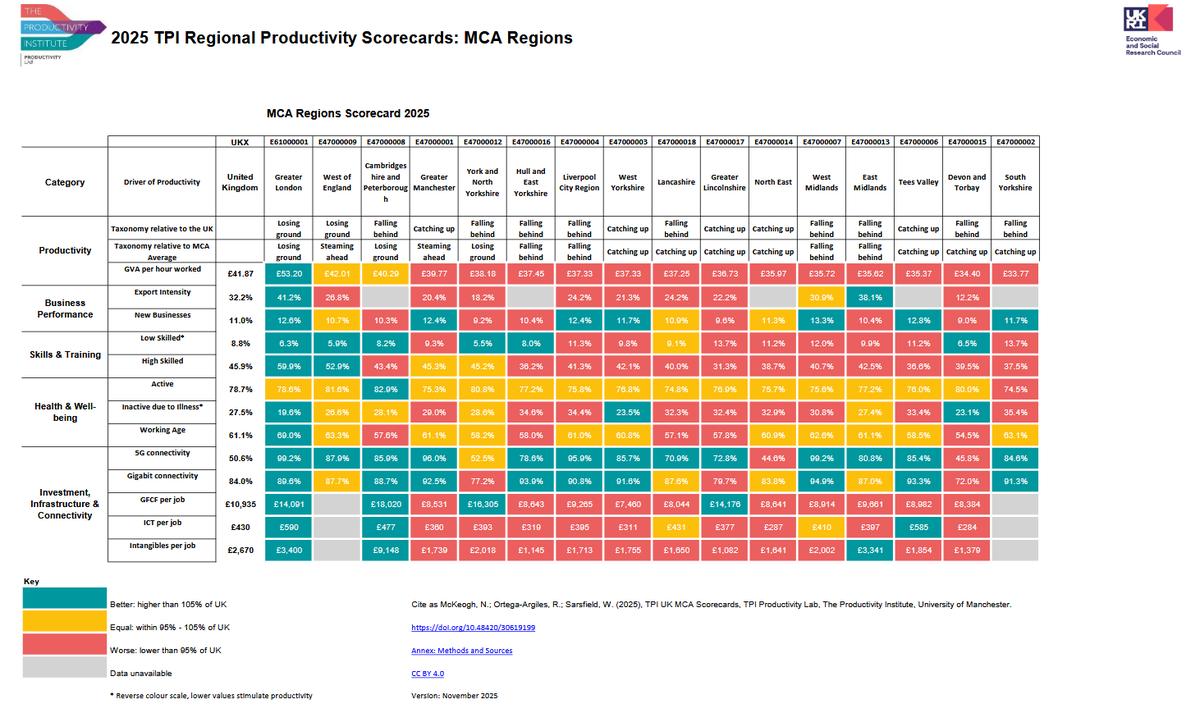
Source: 2025 TPI MCA Regional Productivity Series
One of the interesting features of the TPI MCA Productivity Scorecards is that they provide a clear view of within-variability or inequality in the productivity performance and drivers across the different MCA local areas.
Source: 2025 TPI MCA Regional Productivity Series
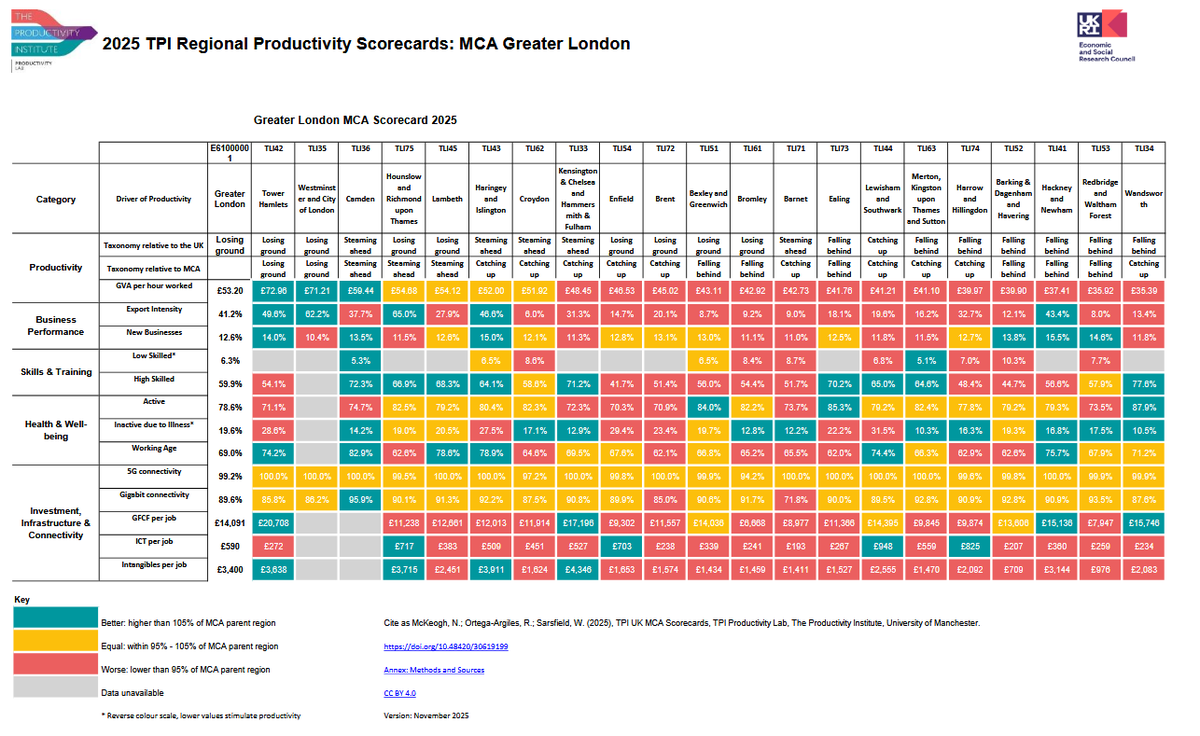
While we have seen that Greater London outperforms other UK MCAs on many general productivity indicators (Table 1), within the region (Table 2), we observe extreme heterogeneity across productivity drivers: central boroughs dominate in GVA, exports, and skills, while outer boroughs lag in investment and connectivity. This suggests that policy interventions must be highly localised to address structural imbalances.
Source: 2025 TPI MCA Regional Productivity Series
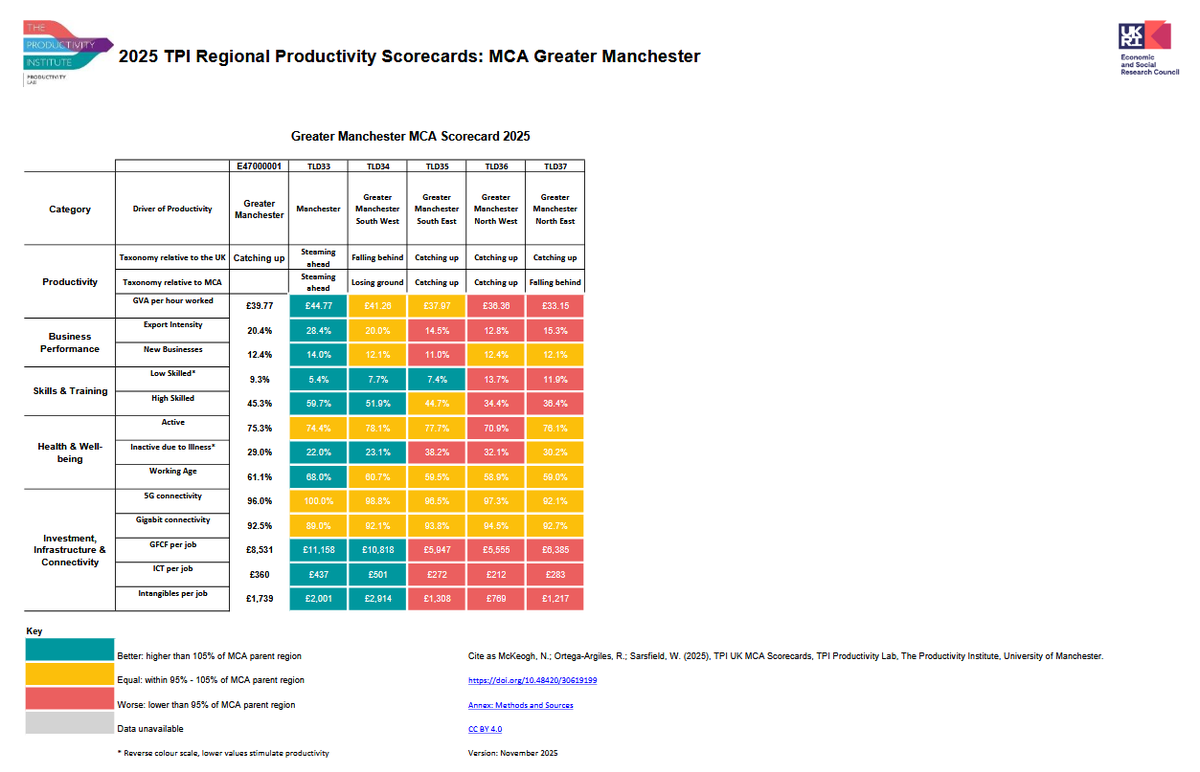
In the case of Greater Manchester (Table 3), the picture is slightly different; there is a significant polarisation, with Manchester either overperforming or matching the country's regional productivity levels, being classified as a Steaming Ahead ITL3 area compared to the UK ITL3 regional average.
Source: TPI Productivity Lab – UK Regional Productivity Growth Data Tool
To illustrate the interregional variability in the Greater Manchester and Greater London areas to complement the comparison of their general performance, we provide a figure that compares how different parts of Greater Manchester and Greater London have done when it comes to productivity since the pandemic, compared to how much economic output each area produced per hour worked in 2023. Each region is shown as a circle—blue for Greater Manchester and dark grey for Greater London. Despite London as a whole being classified as Losing Ground, Figure 2 shows that some London boroughs like Westminster and Tower Hamlets, are performing strongly, while parts of Greater Manchester are making progress but still have lower output.
Greater London and Greater Manchester show contrasting productivity profiles. Greater London has the highest productivity level among all MCA regions, at approximately £50 per hour worked. Still, its long-term productivity growth from 2008 to 2023 is the lowest, at -0.2%, placing it firmly in the Losing Ground category. This suggests London’s economy is highly productive but stagnating in terms of growth. In contrast, Greater Manchester sits near the top of the chart with the highest growth rate of 1.2%, while its productivity level is mid-range at around £40 per hour. This positions Manchester in the Catching Up quadrant, indicating strong momentum in improving productivity despite starting from a lower base than London. In short, London leads in absolute productivity but lacks growth, whereas Manchester demonstrates dynamic growth and is narrowing the gap with more productive regions.
London leads with an average GVA per hour of £53.20, far above Greater Manchester’s £39.77, and shows extreme internal variation, from £72.96 in Tower Hamlets to £35.39 in Wandsworth. Export intensity in London is highly polarised, reaching 65% in Hounslow/Richmond but dropping to 6% in Croydon, while Manchester’s range is narrower (28.4% to 12.8%). Both regions display similar new business formation rates, but London’s skills base is significantly stronger, with high-skilled shares up to 77.6% compared to Manchester’s peak of 59.7%. Connectivity is robust in both, though London invests more heavily in infrastructure and intangibles, reinforcing its competitive edge. Health-related inactivity is notably higher in Manchester, adding to its structural challenges. Overall, London’s dominance in productivity, skills, and investment contrasts with Greater Manchester’s moderate performance and greater vulnerability in health and workforce quality.
Without intervention, regional disparities will persist, as analysed here, undermining national productivity growth and inclusive economic development. A place-based policy approach is essential to ensure balanced growth across the UK.
Potential policy interventions to address regional productivity disparities include a multi-pronged approach. First, targeted skills investment should expand vocational training and higher education in lagging regions while incentivising businesses to upskill workers in digital and advanced manufacturing. Second, improving infrastructure and connectivity is critical, with accelerated 5G and gigabit rollout in rural and coastal areas linked to SME digital adoption programs. Third, establishing regional innovation hubs can foster clusters in underperforming areas to attract high-value sectors, supported by R&D tax credits and grants for local projects. Additionally, export support strategies tailored to service-based regions and enhanced trade facilitation for SMEs can strengthen global competitiveness. Finally, boosting entrepreneurship and finance by improving access to venture capital beyond London and by creating regional accelerators and incubators will help build vibrant start-up ecosystems.