By Alfonso Silva-Ruiz, Marianne Sensier and Raquel Ortega-Argilés
Productivity policies increasingly recognise that places differ not only in their economic performance, but in the underlying assets that shape their growth potential. As a result, local and combined authorities must make investment decisions that reflect these differences, often while operating under tight fiscal and institutional constraints. However, in practice, navigating the volume and diversity of available evidence beyond headline productivity figures remains challenging.
In any investment endeavour, understanding the current landscape is a necessary but often underdeveloped first step. What resources are already available? How are different forms of capital distributed locally? How does a place compare to its neighbours or the wider region? These questions become particularly important at a smaller geographic scale, where place-based approaches can reveal patterns and imbalances that more aggregated data might hide.
As part of the lab’s collaboration with the TPI Investment in Productive Places campaign, we have developed a data tool that characterises capital endowments across UK local authorities, situating individual places within their wider regional context. In this blog post, we will showcase the information displayed in the tool and illustrate how it can be used to support place-based analysis of local economic conditions.
The dashboard includes data for all 361 local authorities in the UK. It organises information into six categories of capital: physical, human, financial, social, natural, and intangible. Taken together, these categories provide a practical way to summarise the local assets that shape economic capacity.
By bringing these forms of capital into a single view, the tool helps users to look beyond individual indicators and focus instead on the overall configuration of local strengths and constraints. This is particularly useful when evidence is dispersed across different areas and difficult to interpret as a cohesive representation of a location.
The tool also simplifies the process of identifying imbalances across different categories of capitals. A place may appear relatively strong in one dimension, such as human or financial capital, while it may struggle with others, including physical infrastructure or natural capital. Seeing these dimensions side by side, it becomes easier to have realistic conversations about priorities, sequencing, and trade-offs.
The tool is designed to support comparative and diagnostic interpretation rather than to serve as a final assessment or ranking judgement. It can be used to explore how different forms of capital vary within a local authority, how these configurations compare with those of neighbouring places or the wider region, and where potential imbalances or constraints might exist. However, it does not establish causal relationships, prescribe investment priorities, or replace detailed appraisal, local insights, or qualitative evidence. Instead, it is intended to provide a structured starting point for place-based discussion and further analysis.
When interpreting the dashboard, it is important to consider several limitations. The indicators used are proxies for broader capital concepts and do not capture all dimensions of local economic capacity. The analysis is cross-sectional, providing a snapshot at a given point in time, and the results may be influenced by data availability and aggregation at the local authority level. Therefore, rankings should be viewed as relative signals rather than definitive judgements, and individual capital dimensions should be interpreted jointly rather than in isolation.
We construct the capital indices in several steps. For each capital, we first group together a set of relevant indicators. Each indicator is then standardised so that local authorities can be compared on a common scale. This is done by measuring how far each authority’s performance sits above or below the median local authority, expressed in standard deviations. Authorities performing better than the median receive positive scores, while those performing worse receive negative scores.
We then combine the indicators for each capital using equal weights to produce a single index per capital. Once the capital indices are calculated, all UK local authorities are ranked, with higher index values corresponding to higher positions in the ranking. The overall ranking is obtained by averaging scores across the six capital dimensions. Full details on data sources, indicator selection, and aggregation methods are provided in the accompanying Methods and Sources document.
To illustrate the information contained in our tool, we briefly discuss each component of the dashboard as displayed below:
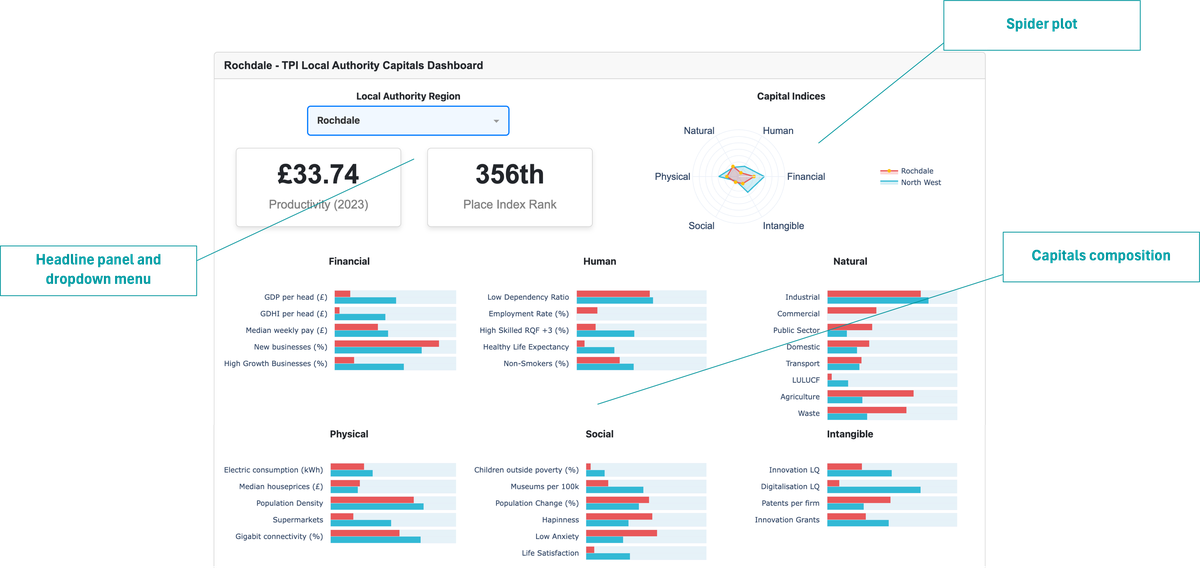
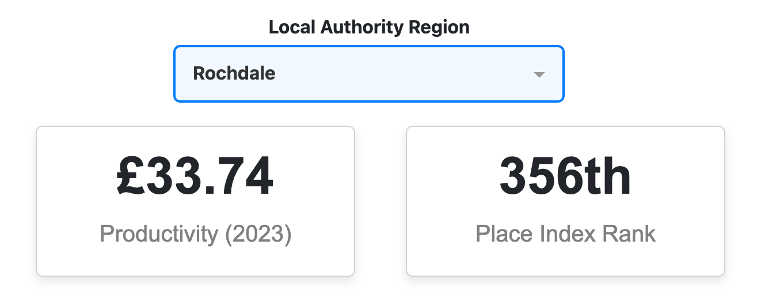
We provide a drop-down menu that allows users to select any of the 361 local authorities in the UK. In addition, we include the most recent headline figures for labour productivity, along with the overall Place Index Rank. This rank ranges from 1 to 361 and is based on the equal-weighted average of capital endowments.
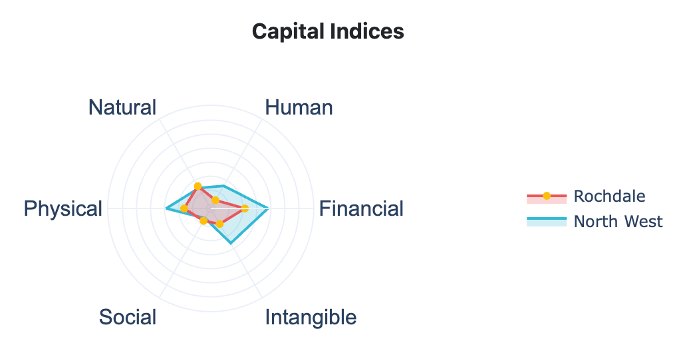
The second component is a spider plot that provides a comprehensive picture across capitals. For each capital dimension, we display the respective ranking among local authorities, which is represented by the light red shaded area. The outer regions of the spider plot reflect higher capital endowment, which results in a better ranking, and vice versa. As a benchmark, we include the capital endowment profile of its parent ITL1 Region.
We take this a step further by disaggregating each component of the spider plot. For each capital dimension, we include the individual variables that jointly constitute it. Following the same intuition as before, the red bars display the values for the Local Authority, whereas the light blue bars denote the values for the parent ITL1 Region. We enrich the comparison by including a ranking by variable, along with the actual values and some descriptive statistics when hovering over the indicator.
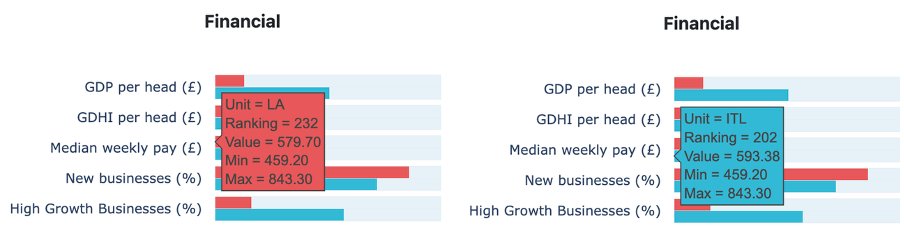
The figure above shows the information about all individual variables included in Financial Capital. When hovering over each variable, a small text box provides basic descriptive statistics for context. For instance, we have highlighted the Median weekly pay (£) variable. In the left panel, we can see that the median weekly pay for Rochdale is £579.7, placing 232nd out of the 361 local authorities in the UK. Similarly, the right panel shows the corresponding values for its parent ITL1 Region, the North West. When hovering over the bars, we can see that, across the UK, the Median Weekly pay (£) ranges from £459.2 (Min) to £843.3 (Max). This same approach applies for the rest of capitals included in the dashboard.
Place-based investment decisions increasingly require an understanding of how different forms of capital combine within local economies. While headline indicators remain important, they are often insufficient for diagnosing local strengths, constraints, and trade-offs in a way that can inform strategic discussions.
The data tool presented here is designed to support that diagnostic process. By bringing together multiple forms of capital across all UK local authorities, it provides a structured way to examine local economic endowments, compare places within their regional context, and identify potential imbalances that merit further attention. Used alongside qualitative evidence and local knowledge, the tool can help policymakers, analysts, and practitioners frame more grounded conversations about investment priorities, sequencing, and capacity constraints. In this sense, it should be seen as part of a broader evidence ecosystem, supporting place-based analysis by clarifying the local economic status quo from which policy choices are made.
Looking ahead, the collaborative work undertaken by The TPI Productivity Lab within the Investment in Places campaign has informed a set of related projects developed independently of that initiative. Ongoing and future analyses will explore how different forms of capital interact, complement, or constrain one another. This research aims to move beyond descriptive comparison toward a deeper understanding of capital complementarities and trade-offs. In particular, this work examines interactions between capitals using multivariate and structural modelling approaches, supporting more nuanced evidence on how configurations of local assets shape productivity and long-term economic outcomes.