By Olga Menukhin and Raquel Ortega-Argilés
Understanding productivity is essential for driving long-term economic prosperity because it measures how efficiently economic actors turn inputs like labour, capital, and innovation into outputs. In the UK, persistent productivity stagnation since 2008 has widened disparities across sectors, regions, and firms.
A new TPI Productivity Lab’s Sector Productivity Scorecard presents an innovative approach to assessing productivity growth patterns. Built on data from the Office for National Statistics (ONS) and complementary data sources, it breaks down productivity into its underlying drivers, enabling policymakers, local authorities and businesses to identify strengths, weaknesses, and factors contributing to productivity performance.
The scorecard examines how resources, investment, skills, innovation and other aspects interact to shape productivity performance across 19 UK economic sectors defined in the Standard Industrial Classification (SIC 2007). Each sector’s performance is benchmarked against the UK median compound annual growth rate (CAGR) over 5 years by economic indicator.
Below UK Average Growth (≤-5%)
G - Wholesale/Retail
C - Manufacturing
I - Hospitality
D - Energy Supply
S&T - Other Services
E - Water & Waste
L - Real Estate
The Sector Productivity Scorecard reveals significant structural differences in productivity performance across the UK economy, for example:
Focusing on the Manufacturing sector as a case study provides deeper insights. While it evidences high R&D and ‘Export Intensity’ reflecting access to international markets, which can drive scale and innovation and efficiency through competition, it also struggles with decreasing labour resources, weak capital productivity, and high costs of capital. These factors signal critical areas concerning resource allocation and overall sector’s health. Additionally, concerns about business dynamics (‘New Business Births’) and ‘Managerial Skills’ further highlight the need for targeted attention.
Together, these insights demonstrate how the scorecard serves as a valuable tool, translating complex ONS data into actionable intelligence, helping policymakers identify where capital investment, skills, or innovation support are most needed.
At the core of the TPI Sector Productivity Scorecard is a simple yet effective framework inspired by the economic production function. In addition to Productivity Output statistics, it groups relevant economic indicators into Direct and Indirect Inputs. This approach captures both the immediate and underlying forces that influence or explain sectoral productivity, as illustrated in the graphic below.
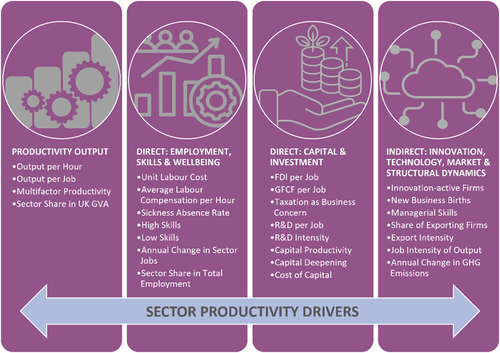
Direct Inputs
Direct inputs represent the tangible resources and factors directly influencing production. These are the foundational drivers:
Indirect Inputs
Indirect inputs are the softer or delayed factors that contribute to long-term productivity gains. Indicators in this driver category capture the enabling environment:
The TPI Sector Productivity Scorecard has been developed as a diagnostic and decision-support tool for assessing productivity across various sectors in the UK. It focuses on productivity inputs rather than attempted to compare sectors directly, as many metrics are not comparable across different sectors. Here are some suggestions of how they can be used by various audiences.
For policymakers:
For Local and Combined Authorities:
For Businesses and Industry Bodies:
Using consistent ONS data by SIC section, the scorecard enables systematic monitoring of:
Each indicator contributes to a comprehensive composite view of productivity performance, revealing not just how much sectors produce, but also the underlying reasons for their productivity levels.
All TPI Productivity Lab’s tools are developed to bridge the gap between data and decision-making. The new TPI Sector Productivity Scorecard collates and transforms complex ONS datasets into a transparent, evidence-based framework that can support industrial policy design and targeted sector support programmes. By creating a broad dataset of economic indicators from publicly available official statistics, we can track annual progress against national productivity goals. We believe that the TPI Sector Productivity Scorecard can turn static data into dynamic insights, helping UK policymakers and industry practitioners understand, manage, and accelerate the drivers of productivity growth at both sector and national levels.
The TPI Sector Productivity Scorecards for each of the 19 UK sectors (SIC 2007), along with a combined overview scorecard and the sources and methods document, are available on The Productivity Lab's Figshare repository, linked below:
The data used in the scorecards is also available in an interactive dashboard. The dashboard will be covered in more detail in the Productivity Lab’s future blogs. Access is available through the TPI Productivity Lab website, linked below: