

Productivity Measurement Analysis series – UK Q2 2026 by Nathan McKeogh and Raquel Ortega-Argiles
On the 18th of August 2026, the Office for National Statistics (ONS) released its flash estimate of UK productivity for the second quarter of 2026 (April to June). These figures are based on quarterly estimates of gross domestic product (GDP) and labour market statistics. The release also includes sectoral labour productivity data for the first quarter of 2026 (January to March).
This publication differs from previous quarterly releases, as the ONS recommends using the Pay As You Earn (PAYE) Real Time Information (RTI), based approach for productivity over Labour Force Survey (LFS), based productivity estimates. The difference between these approaches will be covered below. For this quarterly release by the ONS, interpret both the LFS-based and RTI-based productivity estimates with caution. The move to RTI-based estimates responds to growing concerns about the accuracy and reliability of LFS data, which has been affected by declining response rates and other methodological challenges.
It should be noted that the sectoral productivity data for Q1 2026, released in the same publication, were still calculated using LFS-based methods.
According to the RTI-based estimates, UK productivity (output per hour) in Q2 2026 was 0.7% higher than in Q2 2025. This reflects gross value added (GVA) increasing by 1.2%, outpacing the 0.4% growth in hours worked and resulting in higher recorded productivity.
RTI-based estimates headlines:
In terms of quarter-on-quarter growth, the RTI-based estimates show a 0.8% decline in output per hour in Q2 2026, alongside a 0.6% increase in output per worker. In comparison, the LFS-based estimates report a larger 1.2% decline in output per hour and a more modest 0.1% increase in output per worker. The divergence between the two measures highlights the uncertainty surrounding recent productivity trends and makes the latest quarter difficult to interpret.
Table 1: Flash estimates of labour productivity using RTI estimates. UK Quarter 2 (April to June) 2025 to Q2 2026
Output per hour growth rates
| Period |
Quarter versus 2019 level (%) |
Quarter-on- year ago (%) |
Quarter-on- quarter (%) |
| 2025 Q2 | 3.9 | 1.9 | 0.5 |
| 2025 Q3 | 4.3 | 3.1 | 0.4 |
| 2025 Q4 | 4.3 | 1.4 | 0.0 |
| 2026 Q1 | 5.5 | 2.1 | 1.1 |
| 2026 Q2 | 4.6 | 0.7 | -0.8 |
Output per worker growth rates
| Period |
Quarter versus 2019 level (%) |
Quarter-on- year ago (%) |
Quarter-on- quarter (%) |
| 2025 Q2 | 3.2 | 1.8 | 0.5 |
| 2025 Q3 | 3.4 | 2.0 | 0.3 |
| 2025 Q4 | 3.7 | 1.9 | 0.3 |
| 2026 Q1 | 4.0 | 1.4 | 0.3 |
| 2026 Q2 | 4.6 | 1.4 | 0.6 |
The Labour Force Survey (LFS) has faced problems in recent years due to falling response rates, an issue faced by statistical agencies across the world. Reduced labour market data quality has created uncertainty in regional hours worked estimates, affecting productivity data releases. This has led the ONS to look for solutions to address these issues.
Instead of the LFS labour input data, the ONS has been releasing productivity estimates using employee data from HMRC PAYE RTI. This data is released as part of a joint release between HMRC and the ONS, and contains information about taxpayers in the UK.
RTI data do not include information on self-employment (SE). To address this, LFS self-employment figures are appended to the RTI data. To avoid double counting of self-employed workers, working proprietors (self-employed individuals who exclusively own and operate a business) are removed.
It should be noted that RTI provides an estimate of workers rather than hours worked. Therefore, the hours worked component in the RTI output per hour measure is calculated by multiplying average hours worked from the LFS by the RTI estimate of workers. This means that even the RTI-based estimates of output per hour, rely on the flawed LFS data.
More information about the methods behind the RTI-based productivity estimates is available in the ONS Q1 2025 release.
The ONS is currently developing a new component-based approach to measuring labour productivity to address challenges associated with labour market measurement, which will be more aligned with estimates generated using RTI data. The ONS has said it will release more detail in September, and the accompanying data before the end of the year.
Until the ONS releases this new method of calculating labour productivity, it recommends using the RTI-based productivity figures.
In previous quarterly productivity releases, the ONS has published estimates calculated using RTI data alongside estimates based on the LFS data. This is the first release in which the ONS has recommended using the RTI estimates instead of the LFS estimates.
Figures 1 and 2 compare the RTI + SE and LFS measures side by side over two periods: Q1 2015 to Q1 2019 and Q3 2021 to Q2 2026. The intermediate period of Q2 2019 to Q2 2021 has been omitted to avoid distortion from the COVID-19 shock.
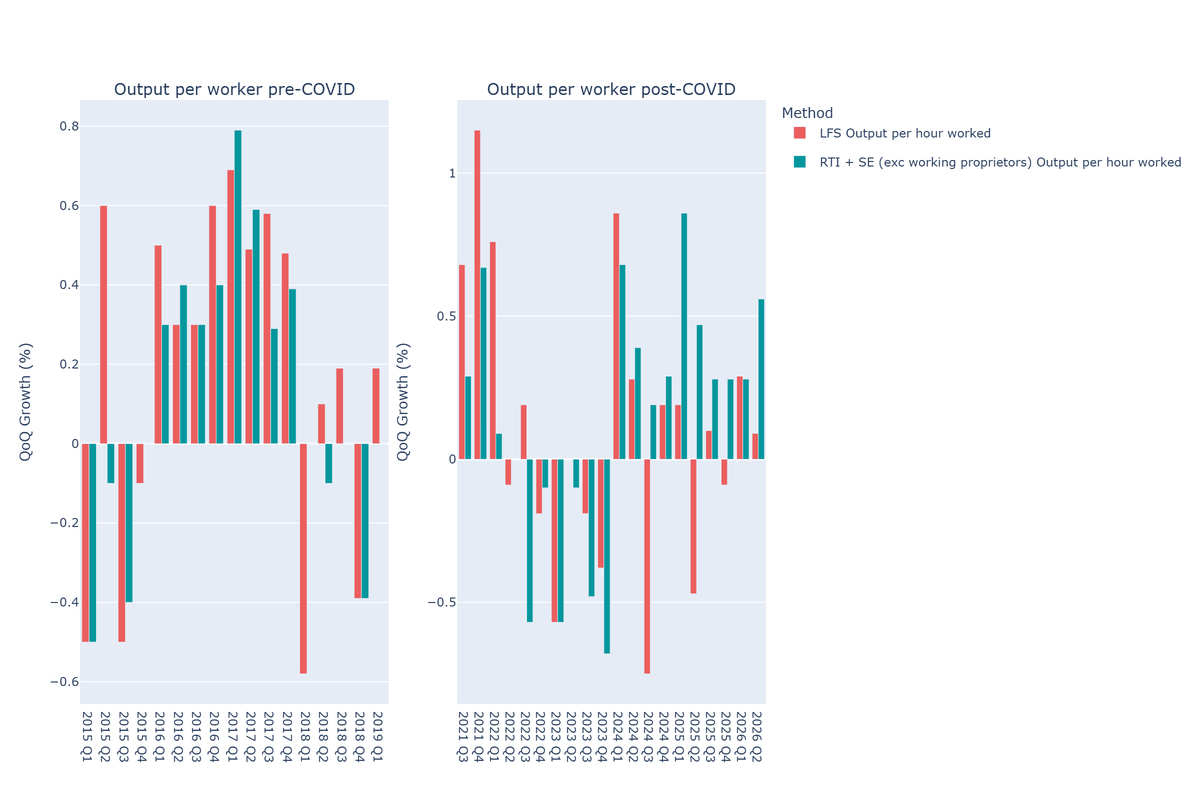
Figure 1: Output per worker (OPW) calculated using LFS vs RTI + SE QoQ Growth (%) for Q1 2015 – Q1 2019 and Q3 2021 – Q2 2026. Data Source: Office for National Statistics, Own elaboration by TPI Productivity Lab
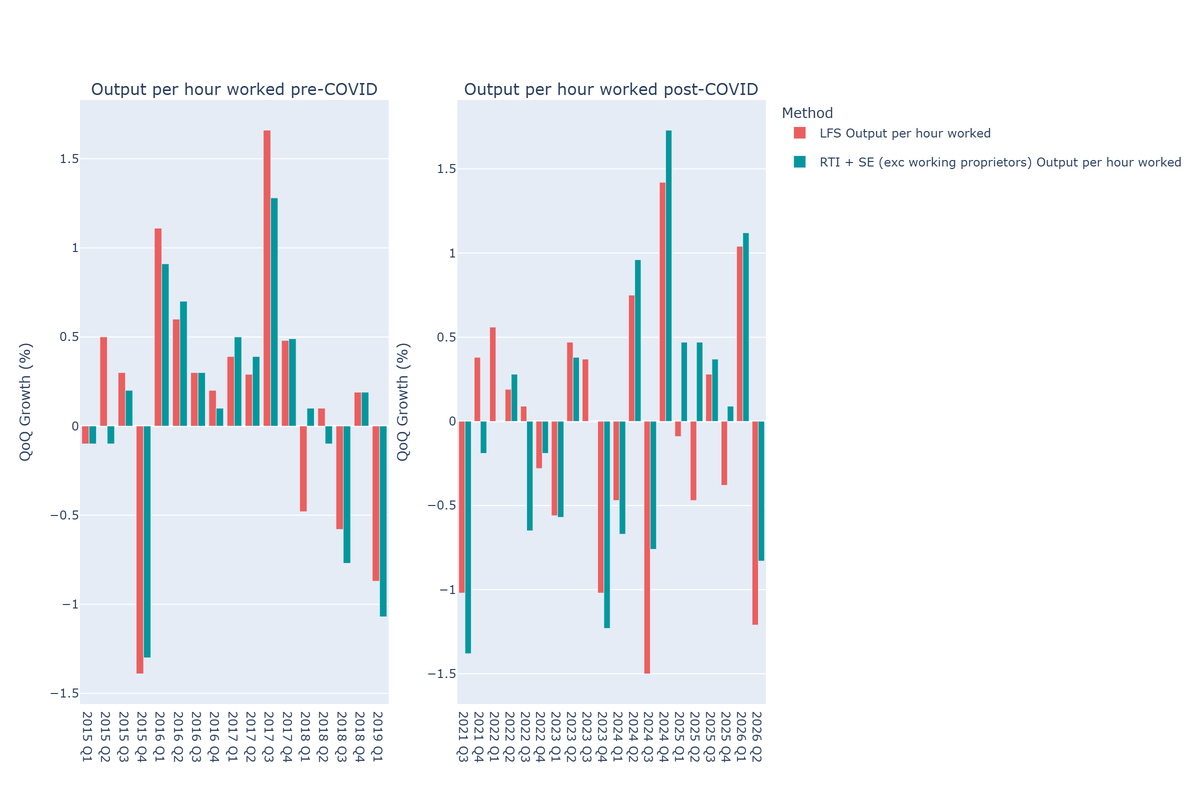
Figure 2: Output per hour (OPH) calculated using LFS vs RTI + SE QoQ growth (%) for Q1 2015 – Q1 2019 and Q3 2021 – Q2 2026. Data Source: Office for National Statistics, Own elaboration by TPI Productivity Lab
As Figures 1 and 2 show, while the two methodologies produce similar overall trends, they diverge significantly, especially in the most recent quarter. The differences are particularly pronounced in output per hour estimates, with the LFS-based measure recording a larger decline than the RTI-based measure in Q2 2026. While some divergence between the two measures is expected given their different approaches to measuring labour inputs, the widening gap in the most recent quarter highlights the uncertainty surrounding current productivity estimates. This reinforces the ONS’s recommendation to use the RTI-based estimates while it develops a new component-based approach to measuring labour productivity.
Sectoral contributions to productivity in the first quarter of 2026 are calculated using LFS-based estimates, which are being replaced by a component-based approach at the end of this year. Therefore, interpret these figures with caution.
Sectoral contributions in Q1 2026 are consistent with prior quarters. The Information and Communication; Professional, Scientific and Technical Activities; and Manufacturing industries were the main drivers of productivity growth, delivering the strongest positive contributions relative to 2019 levels.
The Information and Communication industry contributed the most to productivity growth, at 2.8%. This was driven by GVA rising significantly faster than hours worked, resulting in an improvement in output per hour.
On the other hand, the Human Health and Social Work sector made the largest negative contribution (-0.9%). In this case, hours worked increased substantially faster than output, resulting in lower productivity.
The Energy sector (electricity, gas, steam and air conditioning supply) has reported the biggest decline in productivity of all sectors since 2019, falling by 51.1%, driven by a 46.5% decrease in output accompanied by a 9.4% increase in hours worked. This significant drop seems unusual, and the ONS has flagged data-quality issues in this sector that are causing high volatility, which it expects to resolve in future releases.
Mining and quarrying, finance and insurance, and other services have also suffered decreased GVA since 2019.
To illustrate these sectoral effects:
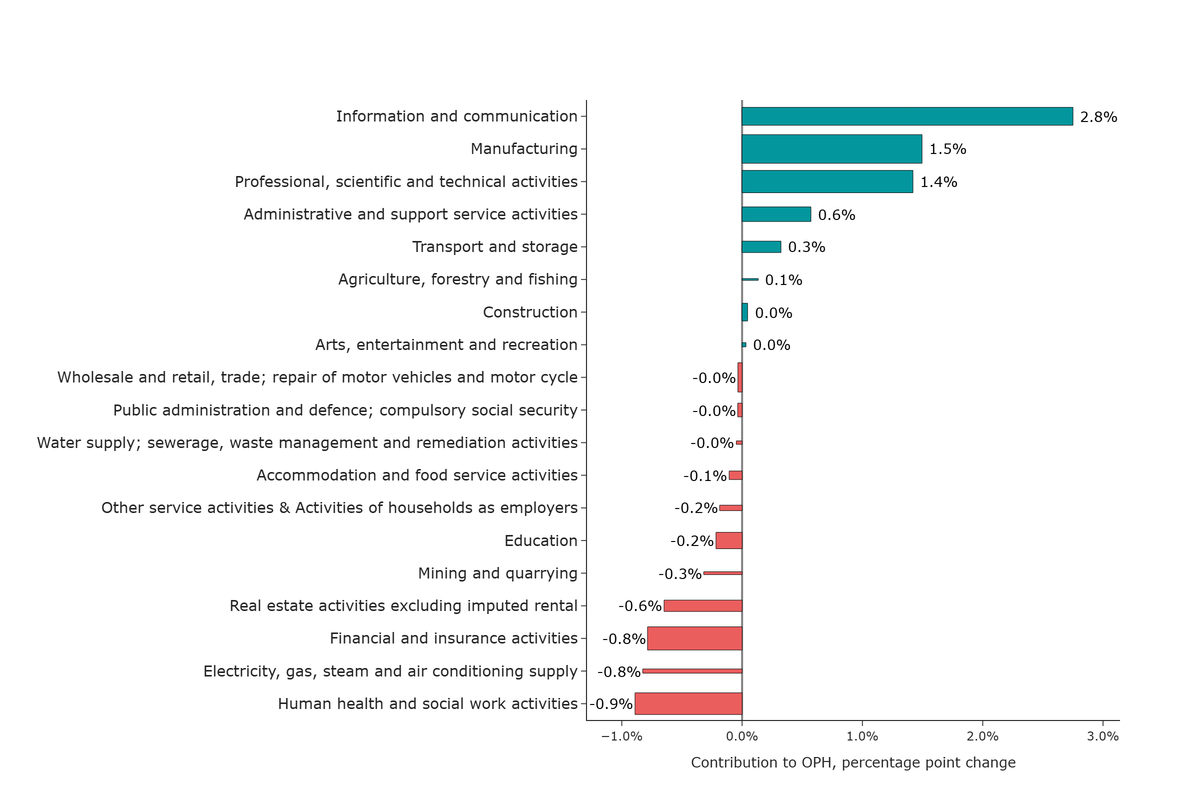
Figure 3: Contribution to growth of output per hour worked by industry, percentage points, Q1 2026 compared with 2019 average, with width of the bar representing relative size of industry. Data Source: Office for National Statistics, Own elaboration by TPI Productivity Lab
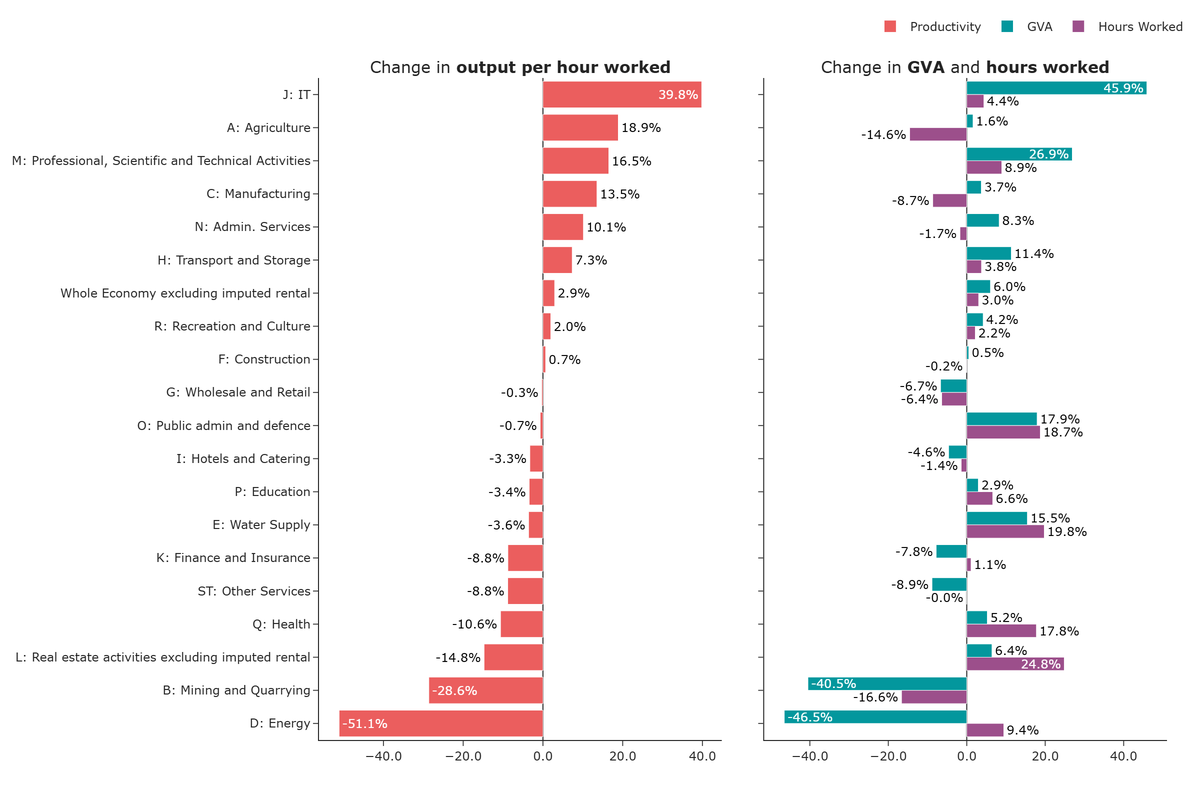
Figure 4: Industry Breakdown: Output per Hour, GVA and Hours worked changes, Q1 2026 compared with 2019 average. Data Source: Office for National Statistics, TPI Productivity Lab reproduction of Office for National Statistics figure
The latest figures indicate that UK real GDP expanded by 0.4% in the second quarter of 2026, following a 0.6% increase in Q1. However, previous years suggest a pattern of strong initial performance followed by weaker growth in subsequent quarters. Figure 5 illustrates this pattern, showing quarterly growth across the UK economy between Q1 2023 and Q2 2026 and highlighting its fragility.
Figure 5: Gross domestic product at market prices, chained volume measure, Q1 2023 to Q2 2026. Data Source: Office for National Statistics, Own elaboration by TPI Productivity Lab
According to the ONS, services were the main driver of this quarter’s GDP growth, with a growth of 0.5%, compared with 0.3% growth in construction and zero growth in production. Of the 14 subsectors that comprise the services industry, 8 contributed positively to growth during this period.
OECD data show that Canada had the highest GDP growth in Q2 among the G7. The UK and the US followed closely behind at 0.4% growth. This data is illustrated in Figure 6. It shows Q2 GDP growth for the G7 nations, as well as aggregates for the total G7, the Euro Area and the European Union.
* indicates that data is provisional at the time of publication
Figure 6: Q2 2026 GDP Growth by Country, quarter-on-quarter, chain-linked volume. Data Source: OECD, Own elaboration by TPI Productivity Lab
Regarding the labour market, unemployment was 4.9% across the UK between April and June 2026, 0.2 percentage points higher than the previous year but 0.1 percentage points lower compared with the previous quarter.
Other than during the COVID-19 pandemic, job vacancies are at their lowest since 2014. This is accompanied by large drops in graduate roles offered in the past few years: dropping by 5.1% in 2025, 14.6% in 2024, and 6.4% in 2023. This is accompanied by a record number of students being admitted to university in 2026. This mismatch between labour supply and demand is, and will likely continue to be, a risk to productivity growth in the UK, especially if difficulties entering the labour market remain prevalent for early-career workers.
Resolution Foundation (RF) analysis has suggested real productivity growth is evident in the previous two years. Using PAYE RTI data, they estimated that output per hour has increased by an average of 1.1% per year between Q2 2024 and Q2 2026. However, it should be noted that these figures reported by the RF also use average hours worked from the LFS as part of their estimates, which introduces some uncertainty.
The RF argue that because they could not find evidence for low-productivity sectors shrinking, low-paid workers being shed, or increased investment, that most of the improvement comes from higher productivity within sectors. In other words, they are saying that productivity growth is real and not just a compositional effect caused by low-productivity industries or occupations shrinking. This could suggest real productivity growth in the past two years, a sentiment shared by Morgan Stanley, as reported by the Financial Times.
Overall, there is some evidence that UK productivity has improved over the past two years, with Q2 2026 recording stronger GDP growth and RTI-based productivity growth than in some recent quarters. However, it remains too early to conclude that this represents a sustained improvement in the UK's long-term productivity performance. The RTI-based measure of output per hour still relies on LFS data to estimate hours worked. In contrast, the divergence between the RTI and LFS measures highlights the uncertainty surrounding recent productivity estimates. The forthcoming ONS releases using the updated methodology should clarify whether the recent pickup represents a genuine change in the UK’s underlying productivity trend.
As the ONS prepares to reveal its new productivity measurement methods, staying informed about these changes will be key to understanding their implications for the UK economy, its industries and individual businesses.