Productivity Measurement Analysis Series – United States, Q1 2026
by Martin Fleming
In the first quarter of 2026, nonfarm business sector labor productivity increased 0.8% from the prior quarter, the U.S. Bureau of Labor Statistics reported on May 7th. Output increased 1.5% and hours worked decreased 0.7%. (All at seasonally adjusted annualized rates.) From Q1 2025 to Q1 2026, nonfarm business sector labor productivity increased 2.9%.
| Sector |
Quarter-on-year ago comparison, SAAR (Q1 2025) |
Quarter-on-quarter comparison (Q1 2021) |
Pre-COVID-19 comparison, SAAR (Q4 2019) |
|---|---|---|---|
| Nonfarm Business | |||
| Labor Productivity | 2.9% | 1.4% | 2.1% |
| Unit Labor Cost | 1.2% | 3.1% | 3.0% |
| Manufacturing | |||
| Labor Productivity | 1.7% | 0.3% | 0.5% |
| Unit Labor Cost | 2.4% | 3.9% | 3.9% |
| Nonfinancial Corporate* | |||
| Labor Productivity | 3.8% | 1.7% | 2.5% |
| Unit Labor Cost | 1.3% | 3.1% | 2.8% |
* Nonfinancial Corporate sector data lag one quarter. Data are for Q4 2025 and comparison is with Q3 2024.
Unit labor costs in the nonfarm business sector increased 2.3% in Q1 2026, reflecting a 3.1% increase in hourly compensation and a 0.8% increase in productivity. Unit labor costs increased 1.2% over the prior four quarters.
Manufacturing sector labor productivity increased 3.6% in Q1 2026 from the prior quarter, as output increased 3.3% and hours worked decreased 0.4%. Unit labor costs in the manufacturing sector increased 2.4% in Q1 2026 from the prior quarter, reflecting a 6.1% increase in hourly compensation and a 3.6% increase in productivity.
There is a very notable difference between productivity and cost conditions in the durable goods and nondurable goods sectors. The durable goods sector is showing more robust output and productivity growth along with much stronger increases in hourly compensation.
By sector, durable goods sector labor productivity increased 5.3% in Q1 2026 from the prior quarter, as output increased 5.4% and hours worked increased 0.1%. Unit labor costs in the sector increased 2.3% in Q1 2026 from the prior quarter, reflecting a 7.7% increase in hourly compensation and a 5.3% increase in productivity.
By comparison, in the nondurable goods sector, labor productivity increased 2.0% in Q1 2026 from the prior quarter, as output increased 0.9% and hours worked decreased 1.0%. Unit labor costs in the sector increased 0.9% in Q1 2026 from the prior quarter, reflecting a 2.9% increase in hourly compensation and a 2.0% increase in productivity.
Nonfinancial corporate sector (approximately 65% of the U.S. economy) labor productivity increased 5.4% in Q4 2025 from the prior quarter, as output increased 4.6% and hours worked decreased 0.7%. Unit labor costs increased 0.8%.
The possibility of a productivity revival has been much discussed in recent quarters. Following a period of instability in early 2025, growth has strengthened across the nonfarm business sector and its principal subsectors – manufacturing and nonfinancial corporates. Output has been growing at above average rates, and labor hours have been increasing slowly.
There continues to be speculation that the stepped-up productivity growth and slower employment growth reflect the shifting status of non-native workers in the U.S. economy. A reduction in non-native workers would reduce labor hours but have an ambiguous impact on productivity. However, the exclusion of unauthorized immigrants – who remain the labor force - from benchmark data would bias the estimates.
Many businesses report total headcount accurately to the BLS from their payroll statistics, which includes unauthorized immigrants and is riskless. However, such headcount is omitted from state unemployment insurance reports - requiring names and Social Security numbers – which is the source data for the Quarterly Census of Employment and Wages used for the benchmarking. It’s possible that the immigration effect grew larger over 2024 and 2025.
Nonetheless, Figure 1 shows the turnaround from a sub-2.0% productivity trend between 2009 and 2019 to a trend growth rate of 2.5%. The current trend, should it continue, will rival the 1997 to 2005 period of strong productivity growth. As is well known, the extended period of very strong growth from the mid-1940s to the mid-1960s has not been duplicated in recent decades.
The data show a similar revival in both the manufacturing sector (~10% of the U.S. economy) and the nonfinancial corporate sector (~65% of the U.S. economy). Of course, there is some overlap between the two sectors.
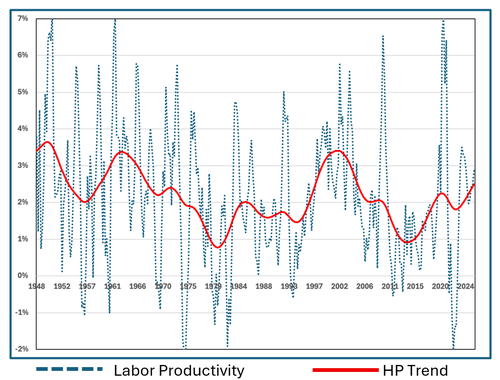
Figure 1: Nonfarm Business Sector Labor Productivity, Year-over-Year Change
Notes: Figure 1 provides a long-term view of nonfarm business sector productivity growth with quarterly growth shown on a year-over-year basis in the blue dashed line and the long-term trend in the solid red line. The Hodrick–Prescott (HP) filter decomposes time-series data into a smooth, long-term trend and a short-term cyclical component.
As is widely speculated, the adoption of artificial intelligence tools and models could be contributing to what appears to be a productivity revival. AI adoption is advancing rapidly, but adoption outside the technology sector is limited.
In late April 2026, the U.S. Census Bureau reported that 19.8% of U.S firms used AI “in any of its business functions” in the last two weeks, perhaps reflecting the widespread availability of generative AI tools. In addition, during the next six months, 23.0% of U.S. businesses “think this business will be using AI in any of its business functions.”[1]
However, MIT FutureTech research among S&P 500 firms – large firms that are likely to be among early adopters – finds that in 2025, less 6% of non-technology enterprises have deeply integrated AI into business processes and 11% are using AI in production.
Conversely, among S&P 500 technology firms, 50% have deeply integrated AI into business processes in 2025, and 12% are using AI in production. Technology sector firms had a huge head start, with 15% having deeply integrated AI into business processes in 2021 – well before the availability of generative AI. Among non-technology firms, only 2% had deep integration of AI capabilities in 2021.
Among non-technology firms, 48% have a project in an advanced pilot stage, whereas technology firms have generally moved beyond that stage, with 28% deploying advanced pilot projects.
While it’s very possible that AI adoption will result in improved aggregate productivity growth in the decade ahead – the hope of all central bankers – currently the technology sector appears to be making an important contribution to the productivity revival, with non-technology firms benefiting from the experience of their technology providers while learning from their own experiments.
[1] See https://www.census.gov/hfp/btos/data_downloads for detailed data. Beginning with the first November 2025 survey, the Census Bureau altered the wording of both questions in the bi-monthly Business Trends and Outlook Survey from a question that asked for the use of AI in “the production of goods and services” to the use of AI for “any business function.” The second October 2025 survey had reported that 10% of respondents used AI in “the production of goods and services” in the last two weeks and 14% expected to use AI in “the production of goods and services” in the next six months. From the discontinued historic data, AI “use in the production of goods and services” gained 2.3 percentage points between October 2023 and October 2024 and 4.0 percentage points between October 2024 and October 2025.