Alfonso Silva-Ruiz, The Productivity Institute Lab
Magdalena Getler, Smart Data Foundry
We often conduct regional analyses to understand average trends in UK labour productivity and its drivers. A regional, top-down perspective helps inform policies aimed at raising nationwide productivity levels. At The Productivity Institute (TPI), however, we also devote significant effort to complementing these regional insights with place-based perspectives using new forms of data.
Recently, we began a collaboration with the Smart Data Foundry (SDF), an Edinburgh-based organisation whose mission is “to unlock the power of financial data and inspire research and policy which reduces poverty and inequality and improves economic wellbeing.”
Through strong industry partnerships, SDF makes de-identified consumer financial data widely accessible to the UK research community via their Financial Data Service (FINDS). Funded by the UKRI-ESRC Smart Data Research programme since February 2025, FINDS provides secure access to financial customer and business data from banks and cloud accounting companies. All information is de-identified, stored within a Trusted Research Environment (TRE) managed by EPCC at the University of Edinburgh, and governed by SDF. This resource offers a geographically and demographically representative view of financial lives in the UK, complementing traditional macroeconomic sources.
Using data from Smart Data Foundry’s Data catalogue, we explore financial wellbeing to illustrate how top-down regional analyses can be enriched with bottom-up insights accessible to researchers.
SDF provides an income variability measure that tracks changes in mean weekly income over a 13-week rolling window[1]. It categorises individuals into three groups: Low (<5%), Medium (5–15%), and High (>15%). Figure 1 shows the evolution of mean weekly salaries for these categories aggregated at postal area level[2]. For reference, the ONS median weekly wages at local authority level are shown in grey.
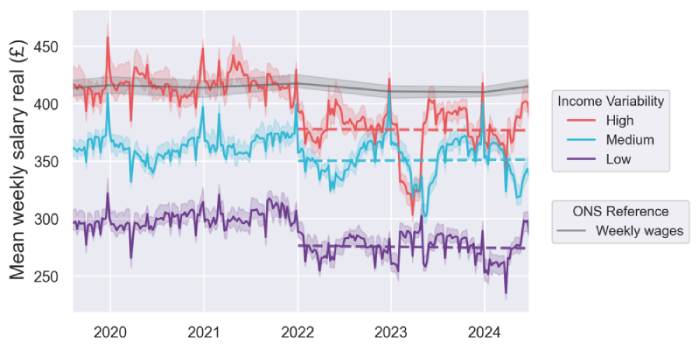
For each income variability category, real mean weekly salaries have stagnated since early 2022. Annual average growth rates are –0.3% (High), –1.67% (Medium), and –0.2% (Low), as indicated by the trendlines in Figure 1. ONS data shows similar patterns at the local authority level, though at lower frequency. The weekly resolution of SDF data allows us to build a richer picture of how incomes evolve in real time. While not directly comparable, ONS median wages provide quarterly data in gross terms and cover salary income only. By contrast, alternative sources such as SDF can complement official statistics and broaden our understanding of income dynamics.
To extend the analysis beyond salaries, we examine additional sources of income. Figure 2 illustrates mean weekly income over time, disaggregated by income variability categories.
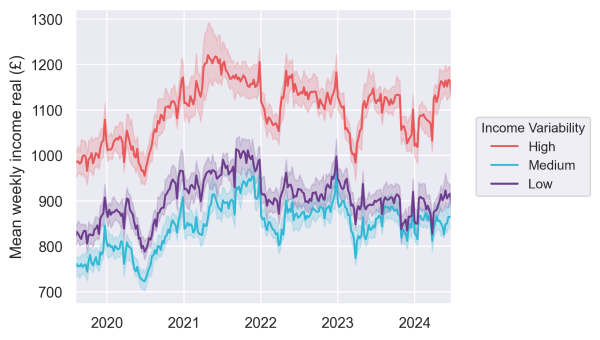
The upward shift in the y-axis confirms that other income streams contribute meaningfully to overall earnings. The SDF ‘Income Sources’ dataset allows us to examine total income patterns across groups of people classified by their main source of income (e.g. salary, benefits, or other). For example, Figure 3 shows the average weekly total income for the 30-34 age band, disaggregated by sex. The transparency of each bar represents the number of accounts for that group, i.e. the total number of observations. For reference, we also include the actual number of observations on top of each bar
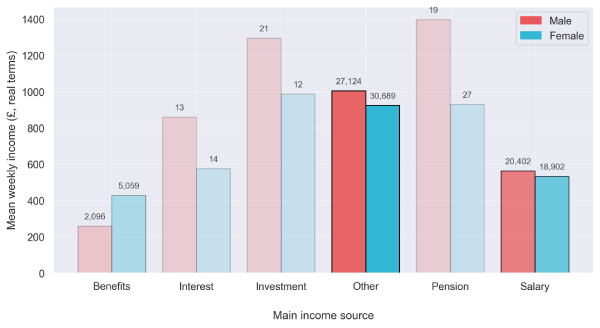
Figure 3: Distribution of mean weekly income (£) in real terms by main source of income and Sex for the age band 30-34 years of age on 2024-06-23. Each category represents individuals whose largest income share over the past 13 weeks came from that source. Total number of accounts are included on top of each bar. Nominal data is adjusted by CPIH from ONS. Categories are based on internal categorisations from NWG. Source: The Productivity Institute Lab with data from Smart Data Foundry (SDF) and ONS.
Figure 3 can help us profiling the main sources of income for the 30-34 age band. Salaries remain a relevant source of income for most individuals, but there is also a share of people that rely on Benefits. Investments, Interests and Pension are the main source of income only for a handful of people. These groups, while smaller, tend to have higher overall total income levels on average. Also, results suggest some distributional differences across sources between Females and Males. Such patterns underscore the need to consider age and gender when designing income support measures. Despite the relevance of the category Others, which includes transfers from other banks and other sources that are not included in the previous categories, it is not possible to further examine since the Income sources dataset contains aggregated data. Nevertheless, the data at granular level is available and accessible for anyone who’s interested through the Trusted Research Environment (TRE) of Smart Data Foundry[3].
We can further investigate how mean weekly income evolves by age group for each category of main source of income. Figure 4 shows the relative growth of mean weekly income by age band for each group within our sample. We have set as base the values for 50-54 age band for reference. In addition, we include the average number of customers over time for each age band, which is reflected in the light grey bars at the bottom of each panel. For reference, we include the maximum number of clients for each main source of income category.
The main takeaways from the figure are twofold. First, we find the classic inverted U shape pattern documented in social research and finance literature, e.g. Hammer et al. (2022), for individuals whose main income source is Salary, Investments, Interest and Others. These panels reaffirm the intuition about generating increasing marginal growth of average weekly income until it reaches a peak halfway through our lives, to start gradually decreasing.
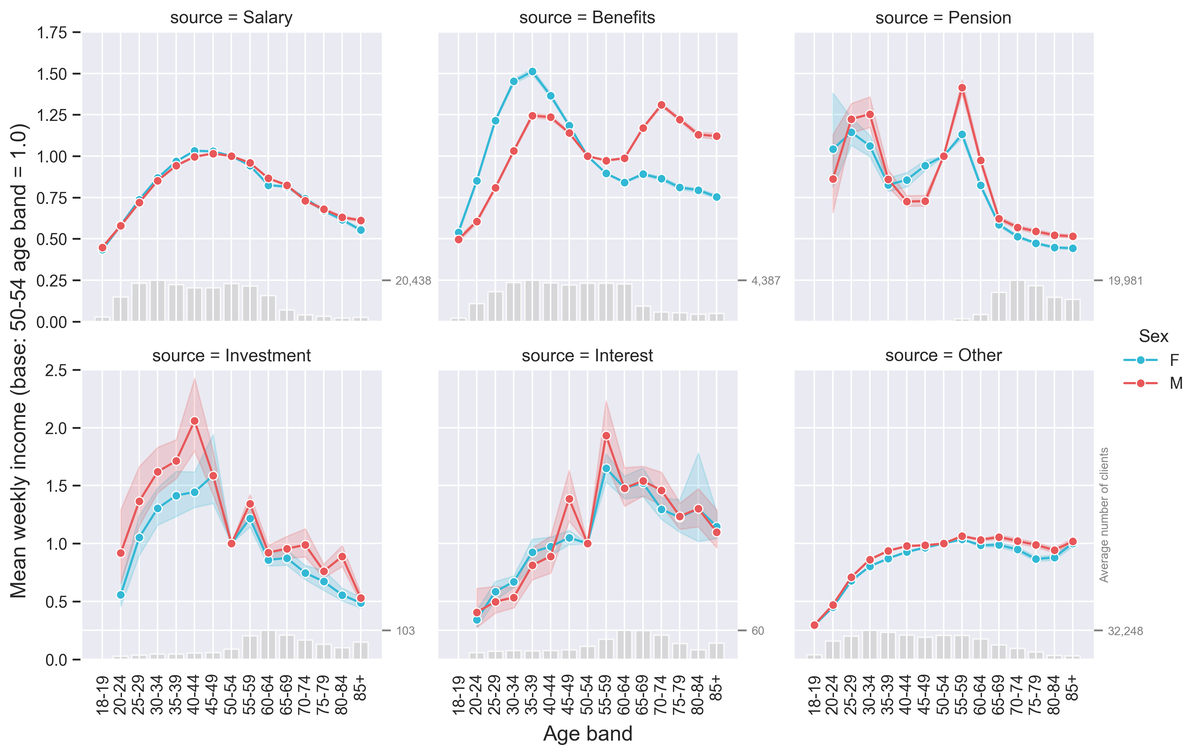
Figure 4: Relative growth of average total weekly income (£, real terms) by age band and main income source. Each panel represents individuals grouped according to their dominant income type. Nominal data is adjusted by CPIH from ONS. Categories are based on internal categorisations from NWG. Source: The Productivity Institute Lab with data from Smart Data Foundry (SDF) and ONS.
In contrast, individuals whose main source of income is benefits show higher total income at the lower and upper ends of the age distribution (< 40 and > 60). Moreover, the gap between male and female population is wider in the former.
Overall, examining total income across groups defined by their main income source reveals nuanced patterns that traditional salary data alone would miss. There’s a natural evolution of income during our lifetime. The number of observations in each group also reveal that, as we age, we become less reliant on salaries and more dependent on our pension. Those who can cultivate Investments and Interests in their youth can benefit from them later on their lives. Average weekly income of individuals whose primary source of income are investments and interests, although with more variability in £, are worth considering when understanding income dynamics.
We examine the financial health of UK population by analysing two main indicators from Smart Data Foundry’s data catalogue: overdrawn accounts and emergency resilience.
The Low Emergency Resilience indicator monitors the number of current accounts that have two or more events where account balance is under 100£ in a rolling five-week period. On the other hand, the overdrawn accounts indicator represents the number of current accounts that have two or more negative balance events in a rolling five-week period. We then plot the ratio as Indicator/Number of Accounts
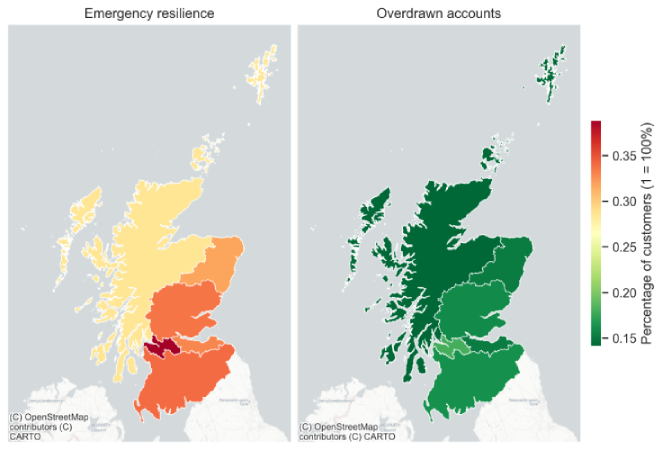
Results show that, despite the controlled number of overdrawn accounts, around 30% of the accounts show on average an event of account balance below 100£, which leaves limited room to withstand market stressed scenarios. This highlights the fragility of household liquidity, even when overdraft use remains limited.
The most apparent limitations of this data include the possibility of customers having multiple accounts and the presence of joint accounts in the data, as there is no way to identify the account holders or whether all account holders are represented in the data.
Similarly, it is impossible to ascertain whether multiple customers in the sample live in the same household, which means that some individuals’ transaction data likely misses certain household expenses paid by other members.
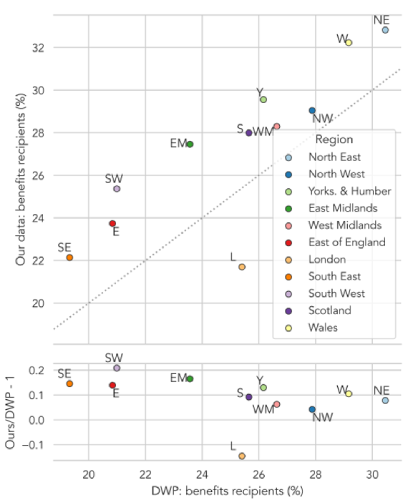
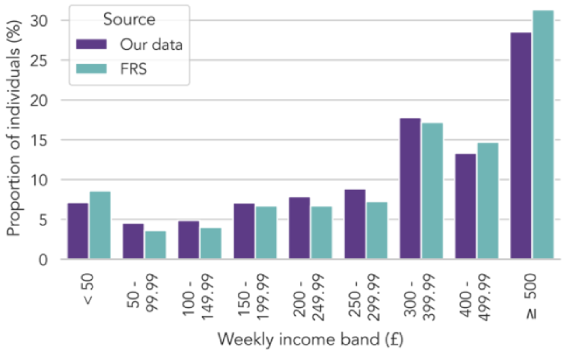
To illustrate the representativeness of their data, Smart Data Foundry provide several analyses, starting with a random sample from NWG for 1.2 million accounts with published national statistics from the ONS, DWP, and Family Resources Survey. We were able to demonstrate that the sample is relatively unbiased in terms of geographic and demographic coverage, income distribution, and representation of major customer groups, including recipients of state benefits and mortgagors (see Figures 6 and 7 for details).
Regional analyses are a fundamental tool for policy making. The insights drawn from top-down approaches can directly inform government efforts that aim to improve social and financial outcomes.
Notwithstanding, the availability of alternative data can help researchers to enrich the top-down macro analysis with bottom-up insights that can provide a better understanding of the intricacies of localities. As alternative data sources become more widely available, integrating them with official statistics will be crucial for capturing the full picture of financial wellbeing across UK regions. Smart Data Foundry is contributing to that extent, supporting researchers and policy makers by unlocking the power of financial data.
This blog entry was produced in partnership between The Productivity Institute and Smart Data Foundry. If you’re reading this and would like to find out more about Smart Data Foundry and the data they hold and steward, please get in touch:
Magdalena Getler for any general queries at Magdalena.Getler@smartdatafoundry.com
You can also find out more on SDF’s website at www.smartdatafoundry.com or see examples of their data analyses at Zenodo at: https://zenodo.org/communities/smart_data_foundry/records?q=&l=list&p=1&s=10&sort=newest.
Smart Data Foundry thanks the Joseph Rowntree Foundation for the collaboration in creating the income variability dataset
Hammer, B., Spitzer, S., & Prskawetz, A. (2022). Age-Specific Income Trends in Europe: The Role of Employment, Wages, and Social Transfers. Social indicators research, 162(2), 525–547.
[1] Measures fluctuation in salary income over a rolling 3-month (13-week) period. Categorised as Low (<5%), Medium (5-15%), and High (>15%). If only one or no income event exists, it is NA.
[2] According to the Income Variability metadata, postal area of the customer-provided address corresponds to the first 1-2 letters of a UK postcode. See more here on how postcodes are broken down - https://en.wikipedia.org/wiki/Postcodes_in_the_United_Kingdom
[3] For more details, please visit https://smartdatafoundry.com/solutions/research